May '22 · 4 MIN
Visualisation of Patents categorisation
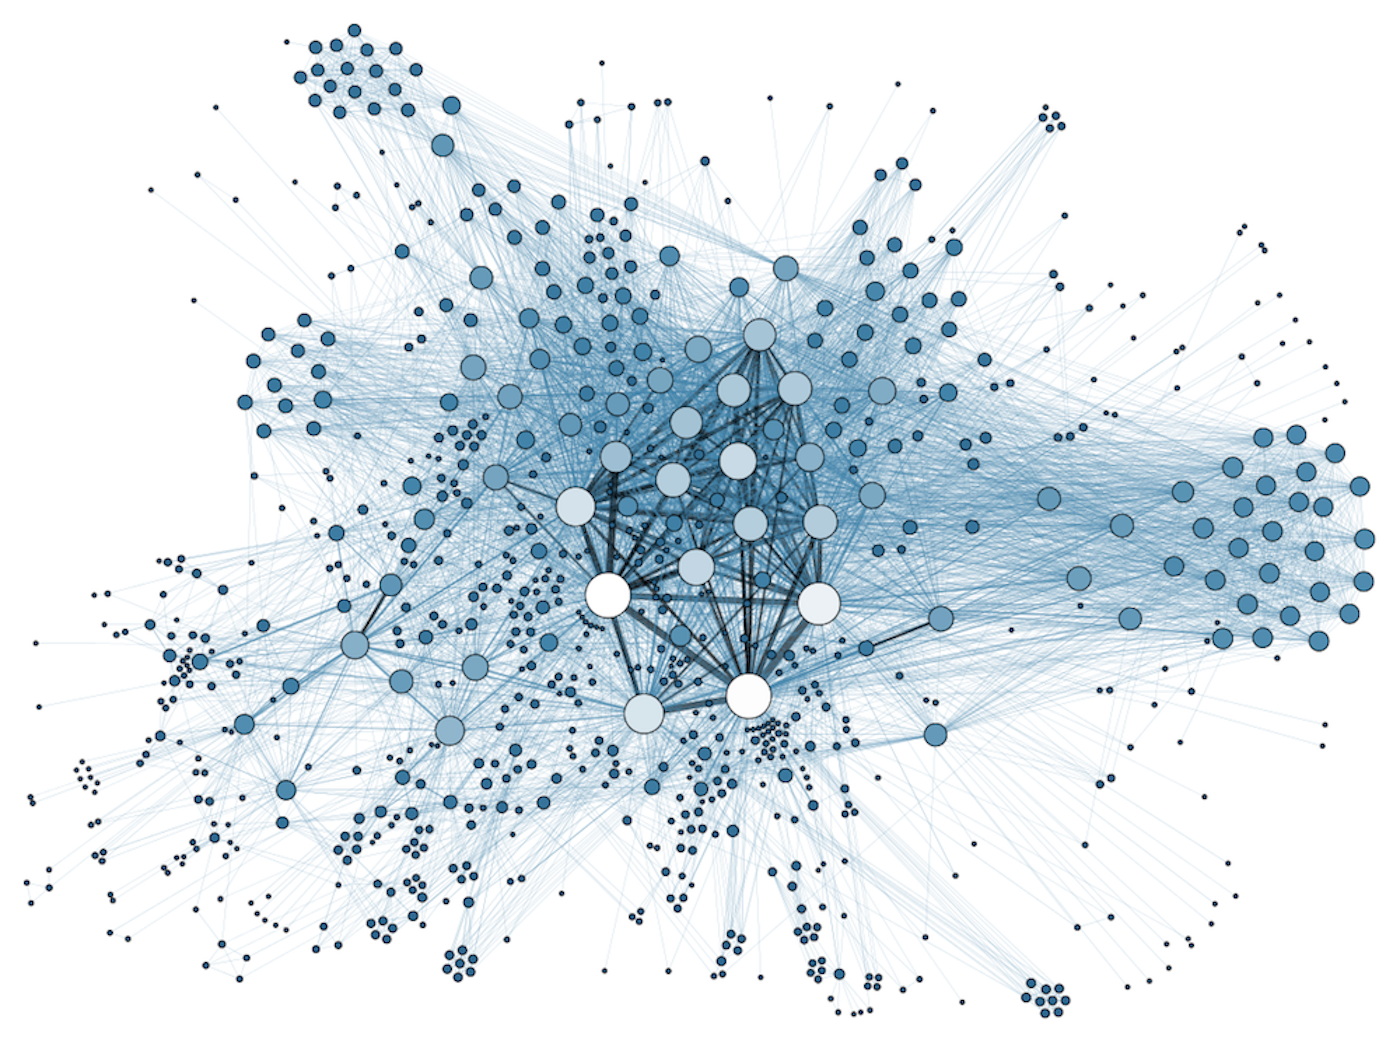
Graphs provide a whole new way to show different values are connected to each other, an example of which is patent classification and its categorization. Going through the cpc_current table on patentsview.org , all patents were classified under categories, sections and subsections and since it was in table form, the magnitude of inter connectivity and the relations between different patents was not that easy to understand but once i imported them to a graph database then the connection between different patents became more clear and patents with similar categories were much easier to query now. Though querying patents on the basis of categories or sections is more suited for a RDBMS database but the plan is to integrate the results of these queries into iChemist, a patent discovery and recommendation engine and use these data to provide better and more accurate suggestions. The process for visualizing the classifications includes these few steps -
Ingesting the data by reading the patent id and extract category and section data.
Use category or section name to filter out data and show the connected nodes of patents.
In the above cited article, the patents are matched with each other on the basis of chemicals, add categories data with it and we have a much more comprehensive dataset and reduce the dataset to be processed by filtering out the patents which are not in the same category and thus reducing processing time.
What is CPC?
Before we delve into patents and their classification, we need to know what is CPC for some context.
The Cooperative Patent Classification (CPC) is a patent classification system, which has been jointly developed by the European Patent Office (EPO) and the United States Patent and Trademark Office (USPTO) The CPC is substantially based on the previous European classification system (ECLA), which itself was a more specific and detailed version of the International Patent Classification (IPC) system.
Using this system, the patents have been classified into different categories, sections, subsections, groups and sequences.
Data Ingestion
To use the data we first need to import the data into Neo4J. To interact with the data i am using Neo4J browser desktop application which makes it easy for me to run cyphers and also makes it much more interactive by letting me visualize the data.
For the purpose of this article, this just uses a small subset of the actual dataset by taking only 1000 patents of the 4M total patents.
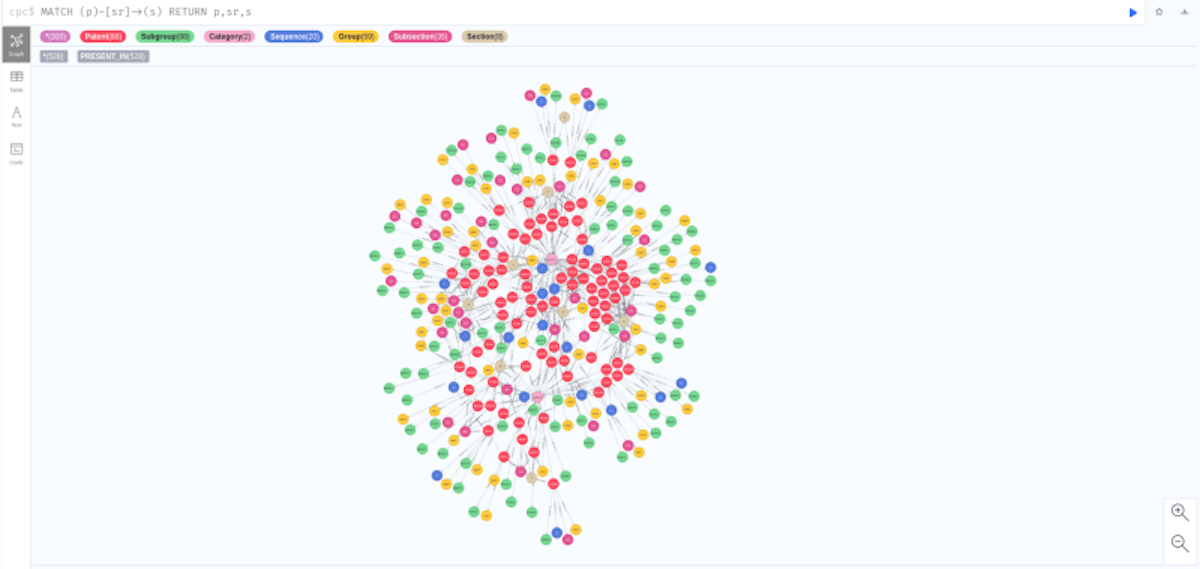
The graph after the data was imported looks like this -
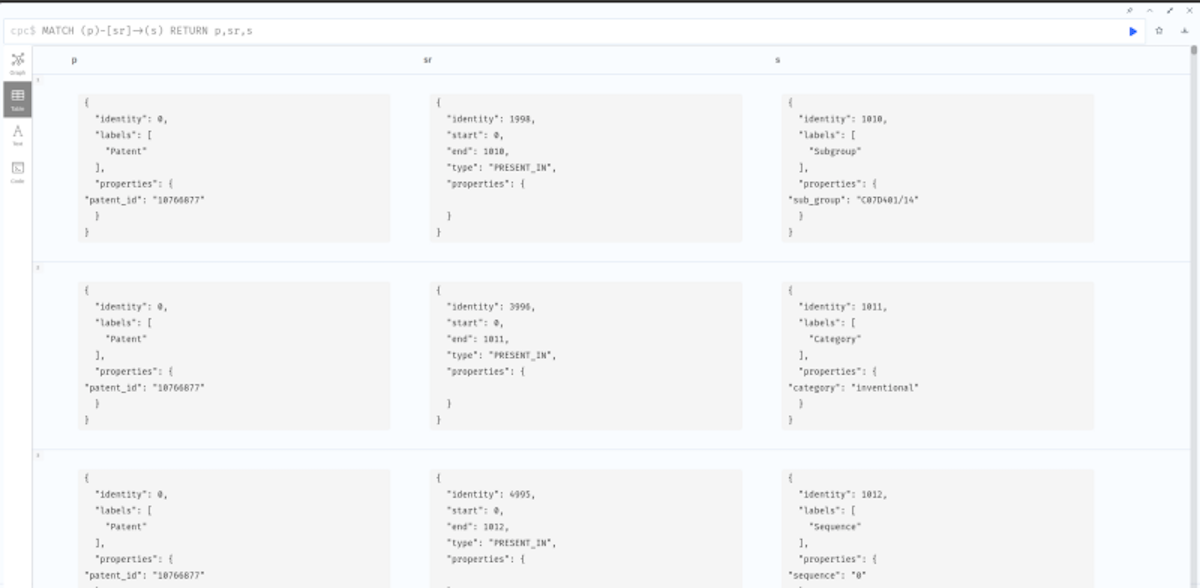
Neo4J also provides us machine understandable formats like JSON -
We can now use the created graph to filter patents on the basis of categories.
How to use this data?
To use this data we have to keep in mind the previously cited article — Visualizing Relationships between Chemicals and Patent Data in mind, as this data can be used to optimize the queries in the cited article. By itself, there is no great advantage of using graph databases but using that we can first query the category of the searched patent and then apply the similarity algorithm query on the filtered nodes thus reducing the nodes processed and thus speeding up the whole process.
To get all Patents with the same category, we need to run this cypher -
Match (c:Category {category:’inventional’ })<-[r:PRESENT_IN]-(p:Patent) RETURN p,r,cThis cypher shows all the patents which fall under the inventional category.
The output for the above cypher is
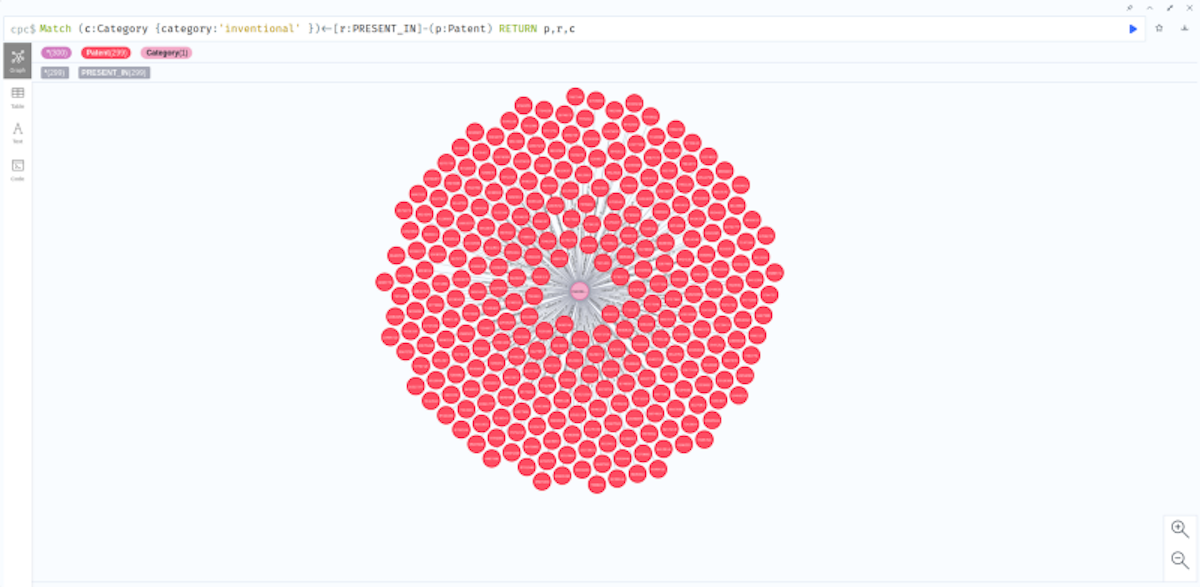
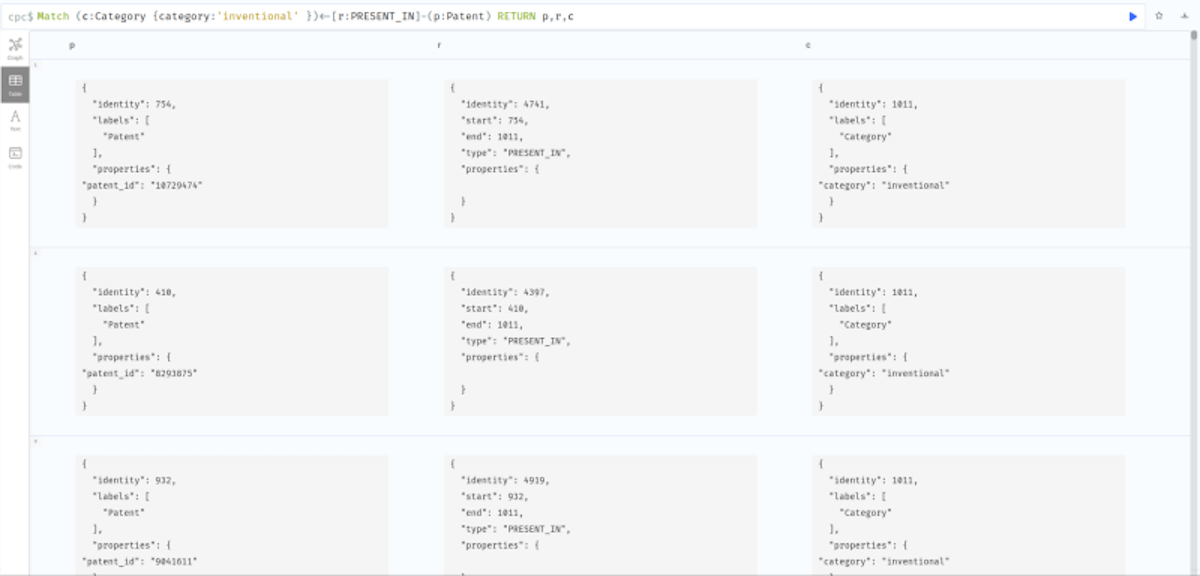
Using the above data we can use only these nodes for finding out the similarity and thus optimizing and bettering the performance of our similarity algorithm.
Adding to the above results, we can also include assignee data and location data to add more filters and return more concise data.
Conclusion
Neo4J provides us with the visual and JSON view of the filtered data and makes it easier for both humans and machines to understand the data and using the above results we can provide much better and accurate suggestions and recommendations faster.The clusters generated using the queries from the previous article incorporating these filters open up exciting arenas to go through patent data and discover relationships between patents and chemicals. It can also be extended to include diseases, patent holders, and pharmaceutical companies as well.
This service acts as a powerful recommendation engine that enables you to leverage the power of graphs to get your required results within seconds. The results can also be fed into a pipeline, opening up even more potential processes to be sped up by using this service.